3. Sustainable Environment
Quanta deeply understands that environmental protection is a key corporate responsibility in achieving sustainable development. The Company has long been committed to mitigating climate change impacts, improving resource efficiency, and embedding green manufacturing and circular economy principles. In response to the global net-zero transition and evolving regulations, the Company has promoted energy transition and carbon management mechanisms. In 2024, the Company completed a comprehensive Scope 1 and Scope 2 greenhouse gas inventory across the Group and launched 81 energy-saving projects, effectively reducing carbon emissions and improving energy efficiency. Moving forward, Quanta will continue leveraging data-driven management to implement reduction measures and innovative environmental programs, building a low-carbon, high-efficiency, and sustainable operational system.
3.1 Climate Action
Quanta recognizes the two-way relationship between corporate operations and sustainable development. While pursuing business growth, the Company also takes responsibility for climate and environmental stewardship. Actively addressing the risks and challenges of climate change and integrating resilience thinking into operations are key to ensuring sustainable business development. Quanta not only aims for a green image but also focuses on strengthening resilience and competitiveness amid global climate shifts.
3.1.1. Climate Change Management
August 2024 marked the 15th consecutive month of record-high global temperatures, showing that climate change has entered an intensified and normalized phase. Since 2021, Quanta has systematically studied climate issues, reviewed potential risks and impacted on business operations, and developed corresponding strategies. In 2022, the Company committed to the 1.5°C target scenario and set a carbon reduction pathway aligned with the Science Based Targets initiative (SBTi), receiving official SBTi approval in 2024-reinforcing the international credibility of its decarbonization goals. In 2024, the Company also began research on internal carbon pricing methodologies to strengthen forward-looking climate governance tools.
Following the Task Force on Climate-related Financial Disclosures (TCFD) framework, Quanta focuses on governance, strategy, risk management, and metrics and targets to guide climate risk and opportunity management. Through scenario simulations and cost analyses, supported by data modeling, the Company assesses potential financial impacts under different scenarios to further refine energy-saving and carbon-reduction strategies, advancing toward resilient, forward-looking sustainability objectives.
Climate Governance Framework
To enhance the effectiveness of climate change management, Quanta has established the "Sustainability Steering Committee" under the Board of Directors to coordinate the Group's sustainability policies and action guidelines. Additionally, the "Sustainable Development Center" has been set up as a subordinate executive and integration unit, responsible for planning, coordinating, and supervising the promotion and implementation of climate-related operations. The Sustainable Development Center regularly convenes working groups related to climate issues to promote communication, collaboration, and risk analysis across different plants and departments. It implements specific energy-saving and carbon reduction measures based on the characteristics of each site to ensure that all units within the Group advance consistently toward unified climate governance objectives.
Furthermore, Quanta continues to deepen the awareness of all employees regarding climate change and sustainability responsibilities through institutionalized processes and internal initiatives. The Company integrates climate governance into operational management and decision-making systems, establishing a top-down execution framework to enhance overall climate resilience and response capabilities. Looking ahead, Quanta will continue to strengthen internal climate education and capacity-building mechanisms within the organization, promoting climate action from the strategic level to the execution level, and integrating sustainability into the core governance system of the Company.
The diagram below illustrates Quanta's climate governance framework, outlining the decision-making chain and division of responsibilities from the Board of Directors to the executive units.
| Board of Directors (Highest Decision- Making Level) |
|
|---|---|
| Sustainability Steering Committee (Governance Coordination Level) |
|
| Sustainable Development Center and Climate-Related Working Groups (Execution and Implementation Level) |
|
Risk and Opportunity Management
Quanta has established a comprehensive climate risk and opportunity management framework, encompassing both the Group headquarters and subsidiaries. In line with the Company's operational characteristics and risk management policies, it systematically identifies, analyzes, assesses, and responds to potential impacts arising from climate change, thereby enhancing organizational resilience, ensuring operational stability, and achieving strategic objectives. Through this climate management framework, Quanta consolidates observations and evaluations from business units on climate risks and opportunities, and categorizes them according to factors such as timing, severity of impact, likelihood, and scope, to identify short-, medium-, and long-term risks and opportunities. Identified risks include physical risks (such as extreme climate events and water resource shortages) and transition risks (such as regulatory changes, market demand shifts, and low-carbon technology challenges), while potential opportunities include changes in customer behavior, alternative transportation models, and renewable energy adoption. The overall management process follows five key stages: risk identification, measurement, monitoring, reporting and disclosure, and response. Under the corporate governance structure, the Sustainable Development Center reports directly to the President's Office to ensure that climate risks are integrated into corporate decision-making. Relevant identification results and management outcomes are disclosed annually in the Sustainability Report, Annual Report, and on the Company's official website, with proactive engagement with stakeholders to strengthen transparency and external trust.
To address the potential impacts of climate change on business operations, Quanta has established a systematic risk and opportunity assessment process, which includes four major steps: data collection, identification, materiality assessment, and response strategy.
Climate Risk and Opportunity Assessment Process
- Collection Phase: Quanta regularly monitors international climate policies, industry trends, and market developments, and integrates operational data and project experience from various internal departments. These serve as the foundational inputs for assessing climate-related risks and opportunities.
- Risk and Opportunity Identification: Through internal cross-functional discussions and with reference to the four core disclosure pillars of the Task Force on Climate-related Financial Disclosures (TCFD)-governance, strategy, risk management, and metrics and targets-Quanta systematically identifies potential climate-related risks and opportunities that are closely tied to its operations. This includes short-, medium-, and long-term physical risks (both acute and chronic) as well as transition risks.
- Materiality Assessment: Prioritize various risks and opportunities based on their likelihood of occurrence and potential impact, identifying material issues to serve as the basis for the Company's sustainability strategy and action planning.
- Response Strategy and Financial Impact Assessment: For each identified risk and opportunity, the relevant specialized departments shall formulate concrete management approaches and mitigation strategies, continuously monitor the effectiveness of management and progress of improvements, and regularly report to senior management and the Board of Directors to ensure the effective operation of decision-making mechanisms and governance performance.
3.1.2. Climate Commitments and Actions
Climate Response Strategy
Aligned with the TCFD framework, Quanta systematically identifies and assesses the risks and opportunities arising from climate change. The Company collects analyses from business units regarding potential climate impacts, considering factors such as timing, impact severity, probability, and scope. Based on these factors, climate-related risks and opportunities are identified across short-term (1-3 years), medium-term (3-5 years), and long-term (more than 5 years) time horizons. The risk categories are primarily divided into two types: Physical risks include short-term climate events (e.g., extreme rainfall, droughts, tropical cyclones) and long-term climatic trends (e.g., changes in average precipitation) that may pose potential threats to operations and supply chains. Transition risks include regulatory pressures associated with the shift to a low-carbon economy (such as carbon taxes, cap-and-trade programs, and emissions trading schemes), market changes (such as demand and price volatility for low-carbon products), and technological challenges (such as investments in new technologies and the associated transformation costs).To strengthen the integration of climate risk management, Quanta has established a series of climate-related policies, including the "Greenhouse Gas Policy," "Environmental Protection Policy," and "Net Zero Emission Climate Declaration". These serve as the common foundational guidelines for the entire Group's sustainable governance and action implementation, guiding all sites to advance carbon reduction and climate resilience efforts under a unified strategic direction. Conversely, the climate transition may also present potential opportunities. Quanta has identified key opportunity areas such as shifts in customer preferences towards sustainable products and green supply chains, exploration of low-carbon alternative transportation modes, and operational advantages from adopting renewable energy and low-carbon manufacturing processes. The aforementioned risks and opportunities have been incorporated into Quanta's climate strategy assessment process and are continuously reviewed on a rolling basis to evaluate their potential financial and operational impacts. The detailed identification results are listed in the table below.
| Risk Category | Subcategory | Risk Item | Content | Likelihood of Occurrence | Occurrence Time | Impact Intensity | Impact Scope | Potential Financial Impact | Opportunity Item | Mitigation and Adaptation Plan |
|---|---|---|---|---|---|---|---|---|---|---|
| Physical Risk | Extreme Climate | Extreme Rainfall and Drought | A direct or indirect disaster caused by extreme global or regional rainfall and drought | Unlikely (33-50% chance of occurrence) | Long-term | High | Direct company operations | Supply chain disruptions leading to increased direct costs | Enhancing the completeness of the Group's contingency plan | Strengthen inter-factory contingency planning across the group to mitigate operational risks posed by extreme weather events. |
| Tropical Cyclone | A direct or indirect disaster caused by an increase in the number or intensity of regional tropical cyclones. | Unlikely (33-50% chance of occurrence) | Short-term | Medium to High | Direct company operations | Increase in direct costs | Enhancing the completeness of the Group's contingency plan | Strengthen inter-factory contingency planning across the group to mitigate operational risks posed by extreme weather events. | ||
| Climate Pattern Change | Change in average rainfall | A direct or indirect disaster caused by a global or regional change in average rainfall. | Very unlikely (<10% chance of occurrence) | Long-term | Low | Direct company operations | Supply chain disruptions | Enhancing the completeness of the Group's contingency plan | Strengthen inter-factory contingency planning across the group to mitigate operational risks posed by extreme weather events. | |
| Transition Risk | Regulatory Risk | Emissions Cap/Trading | Regulations introduced by domestic or international governments to control the emission limits of greenhouse gases. Establish a cap on total carbon emissions and implement an allowance trading system. | Highly likely (>90% chance of occurrence) | Long-term | High | Direct company operations | Increased capital expenditures | Participation in renewable energy projects |
|
| Carbon Tax/ Carbon Fee | Carbon tax and carbon fee systems in various countries―including the EU's CBAM and Taiwan's Climate Act―are being progressively implemented. These regulations increase pressure on enterprises to reduce emissions and the costs associated with carbon emissions, directly driving up operational costs. These policies increase pressure on enterprises to reduce emissions, and the monetization of carbon output is driving up direct costs. | Highly likely (>90% chance of occurrence) | Short-term | Low | Direct company operations | Increase in direct costs | Participation in the Carbon Market |
|
||
| Uncertainty in New Regulations | Many international and domestic government agencies are in the process of developing new sustainability related regulations. Most remain in draft or pilot phases, with unclear implementation timelines, specific requirements, and supporting mechanisms. | To a certain extent likely (>50% chance of occurrence) | Medium-term | Medium | Direct company operations | Increase in direct costs | Low Carbon Energy Find New Opportunities |
|
||
| Market Risk | Uncertainty in Market Information | Due to global or regional uncertainties in market information, particularly related to climate change issues, it is difficult to grasp the future market demand for products or services. | To a certain extent likely (>50% chance of occurrence) | Medium-term | High | Direct company operations | Decreased revenue | Customer Behavior Changes Transportation Modes |
|
|
| Demand for Low-Carbon Products and Services | Due to factors related to climate change issues, the currently provided products and services that are high energy consuming or high carbon emitting are not in line with market demand and face elimination. | Unlikely (33-50% chance of occurrence) | Long-term | Medium to High | Direct company operations | Loss of existing customers | Transforming to low-carbon products to capture market advantage |
|
||
| Technological Risk | Investment in New Technologies | Due to climate change related factors, investments must be made in new technologies. Nevertheless, incorrect positioning or investment targets, as well as technological bottlenecks, can lead to investment losses. | To a certain extent likely (>50% chance of occurrence) | Long-term | Medium | Direct company operations | Increased capital expenditures | Higher internal resource utilization costs |
|
|
| Transition to Low-Carbon Technologies | Due to factors related to climate change issues, adopting innovative processes or treatment procedures under existing conditions or changing the way services are provided results in financial expenditures. | Unlikely (33-50% chance of occurrence) | Long-term | Medium to High | Direct company operations | Increased capital expenditures | Transforming to low-carbon products to capture market advantage |
|
Regarding the physical risks associated with climate change, Quanta assesses the potential impacts of extreme weather events and long-term climatic shifts on its operations, drawing on climate data and international scenario simulation results. Shortterm risks primarily stem from extreme rainfall, drought, and tropical cyclones, which may lead to damage at operational sites, supply chain disruptions, or increased operating costs. According to simulation data, the probability of such events occurring before 2040 is approximately 33% to 50%, with a moderate impact intensity and an effect range across Quanta's major operational locations.
Additionally, Quanta has conducted an analysis of physical risks that may arise under scenarios of extreme rainfall and drought, including flooding, landslides, debris flows, and water shortages. The analysis references multiple sets of international climate scenario combinations, such as SSP and RCP, to examine temperature rise pathways and socioeconomic assumptions under cross-scenario variations. This simulation of the frequency of different extreme climate events and their potential impacts on operational sites serves as a critical basis for Quanta's climate adaptation strategies and mediumto long-term infrastructure planning. In the scenario analysis of extreme climate events, Quanta has incorporated multiple international standard scenarios including SSP1- RCP2.6, SSP2-RCP4.5, SSP3-RCP7.0, and SSP5-RCP8.5 to assess the exposure levels of its global operational sites to acute physical risks such as flooding, debris flows, and landslides. The assessment results indicate that the majority of Quanta's global sites and assets are located in areas classified as no-risk zones, with the overall level of physical risk assessed as relatively low.
Regarding the physical risks related to water resources, Quanta has conducted a mediumto long-term trend assessment specifically focusing on water scarcity risks. The results indicate that under the scenarios SSP2-RCP4.5, SSP3-RCP7.0, and SSP5-RCP8.5, the Taoyuan and Kaohsiung regions in Taiwan are identified as facing medium to high levels of water scarcity risk (as indicated by the color blocks in the figure). Moving forward, Quanta will continue to closely monitor the extent of the impact and the trend of changes. In the overall physical water resource risk analysis conducted under baseline conditions, it was shown that QMB (Quanta Manufacturing Bangkok) is identified as being in a higher-risk area under the SSP1-RCP2.6, SSP3-RCP7.0, and SSP5-RCP8.5 scenarios. QSMC (Shanghai plant) is categorized as a high-risk level, while other plants such as QCI (Taiwan) and QCMC (Chongqing) are mostly classified as medium to low risk (indicated by triangles in the figure). Quanta will continue to strengthen its short-, medium-, and long-term physical risk monitoring mechanisms based on international climate scenario simulation results and the risk levels of each operational site. Additionally, by integrating water resource management strategies, the Company aims to reduce the potential impact of climate risks on operations, thereby enhancing overall corporate resilience.
- ▲Under the baseline scenarios of SSP1-RCP2.6, SSP3-RCP7.0, and SSP5-RCP8.5, the overall water resource risk is assessed as medium to low.
- ▲Under the baseline scenarios of SSP1-RCP2.6, SSP3-RCP7.0, and SSP5-RCP8.5, the overall water resource risk is assessed as high.
- ▲Under the baseline scenarios of SSP1-RCP2.6, SSP3-RCP7.0, and SSP5-RCP8.5, the overall water resource risk is assessed as extremely high.
- ●Priority should be given to water scarcity risks under the SSP2-RCP4.5, SSP3-RCP7.0, and SSP5- RCP8.5 scenarios.
- ●Under the SSP3-RCP7.0 scenario, water scarcity risks should be prioritized.
Climate Indicators and Targets
In response to the global challenge of climate change and growing stakeholder expectations regarding corporate carbon reduction, Quanta has established clear, phased climate action targets to advance science-based emissions reduction and net-zero transformation. In 2022, the Company committed to the 1.5°C carbon reduction pathway and, in 2024, received official approval from the Science Based Targets initiative (SBTi), affirming Quanta's status as a low-carbon enterprise aligned with international standards. Using 2022 as the baseline year, Quanta aims to achieve the following targets:
| Near-Term Targets (by 2030) | Long-Term Targets (by 2050) |
|---|---|
|
|
Quanta conducts annual greenhouse gas inventories covering Scopes 1, 2, and 3, and performs internal audits, external audits, and third-party verification in accordance with the ISO 14064 standard to ensure data transparency and accuracy. To support carbon reduction, the Company advances energy efficiency initiatives and integrates renewable energy across operations. Key indicators include absolute greenhouse gas emissions for all scopes, renewable energy usage rate, supplier and customer coverage with validated SBTs, and progress in assessing the financial impacts of significant climate risks. Through regular inventories and quantitative data analysis, Quanta systematically evaluates the effectiveness of its climate actions to guide strategy adjustments and resource allocation. Looking ahead, Quanta is committed to achieving Net Zero Emissions by 2050 and will periodically review and update its targets and action plans in alignment with international standards such as TCFD, SBTi, and ISSB, thereby strengthening its low-carbon governance capabilities and leading the enterprise toward climate resilience and sustainable growth.
3.2 Energy and Resource Management
Quanta upholds the philosophy of coexistence with the Earth and is committed to reducing the environmental impact of its operations. The Company actively responds to global environmental challenges such as climate change, resource depletion, and ecological degradation, focusing on key environmental topics such as energy use, waste management, and water resource utilization. From the research and development design stage, it emphasizes waste reduction and pollution prevention throughout the production process, promotes efficient resource utilization and packaging material reuse, and implements institutionalized management and audit mechanisms under the ISO 14001 Environmental Management System across all manufacturing sites. The P-D-C-A cycle is adopted to ensure regulatory compliance and continuous improvement. The Company has also long invested in environmental protection expenditures to support sustainable development through concrete actions. In 2024, environmental expenditures totaled NT$36.58 million for the Taiwan headquarters and RMB 24.04 million for its manufacturing sites in China. These funds were primarily allocated to energy-saving projects, equipment upgrades, waste treatment, and environmental monitoring, demonstrating Quanta's commitment to environmental protection and sustainable management.
3.2.1 Energy Management
To enhance energy use efficiency and reduce energy consumption during operations, Quanta has established an energy management policy and practical actions, actively implementing and enforcing the ISO 50001 Energy Management System. Through a systematic energy management framework and third-party verification and audit mechanisms, the Company effectively identifies high energy consumption areas in each plant and continuously optimizes equipment energy efficiency and improves processes. As of 2024, Quanta has obtained ISO 50001 certification for QCI, QSMC, QCMC, QMB, and QMMC, demonstrating the Company's commitment to actively promoting energy management across all operational locations.
In addition, the Company strictly complies with energy-related regulations and prioritizes the procurement of products and services with high energy efficiency and environmentally friendly certifications, thereby implementing energy conservation and carbon reduction through concrete actions. Quanta has also established clear energy performance indicators and implemented multiple energy management commitments, including enforcing management systems, meeting customer energy-related requirements, promoting energy-saving actions, and enhancing internal energy awareness. The Company continuously advances toward its operational goals of energy conservation, carbon reduction, and environmental sustainability.
Energy Consumption
According to 2024 statistics, electricity remains the primary source of energy consumption for the Company, with electricity usage of 639.7236 kWh per million NTD of revenue. In addition to electricity, some plants also use diesel and natural gas to meet operational needs. Diesel is used for generators and official vehicles, while natural gas is primarily used for heating equipment. In 2024, total energy consumption was 2.4178 GJ per million NTD of revenue. Notably, QMF utilizes Bloom Energy's natural gas-based clean energy solutions, integrating solid oxide fuel cell (SOFC) technology through a strategic partnership. This initiative further enhances energy efficiency and power supply stability while reducing carbon emissions, addressing the significant electricity demand challenges brought about by rapid business expansion.
| Energy | Unit | 2021 | 2022 | 2023 | 2024 | |
|---|---|---|---|---|---|---|
| Electricity | Self-generated and Self-used Renewable Energy | Megawatt-hours (MWh) | 0 | 0 | 0 | 4,685.4070 |
| Gigajoules (GJ) | 0 | 0 | 0 | 16,867.4652 | ||
| Purchased Renewable Energy: Renewable Electricity | Megawatt-hours (MWh) | 0 | 0 | 7,384.7640 | 19,816.1380 | |
| Gigajoules (GJ) | 0 | 0 | 26,585.1504 | 71,338.0968 | ||
| Purchased Renewable Energy: GEC/REC/Environmental Attributes | Megawatt-hours (MWh) | 0 | 217,655.0000 | 259,666.0000 | 404,262.3100 | |
| Gigajoules (GJ) | 0 | 783,558.0000 | 934,797.6000 | 1,455,344.3160 | ||
| Purchased Non-renewable Energy | Megawatt-hours (MWh) | 1,266,979.2091 | 839,565.5280 | 847,180.4628 | 877,992.1567 | |
| Gigajoules (GJ) | 4,561,125.1528 | 3,022,435.9008 | 3,049,849.6661 | 3,160,771.7641 | ||
| Total Electricity Consumption | Megawatt-hours (MWh) | 1,266,979.2091 | 839,565.5280 | 854,565.2268 | 902,493.7017 | |
| Renewable Energy Utilization Rate (Electricity) | (%) | 0% | 25.92% | 31.25% | 47.51% | |
| Heating | Kilocalorie (kcal) | 0 | 0 | 0 | 0 | |
| Gigajoules (GJ) | 0 | 0 | 0 | 0 | ||
| Diesel | Kiloliters (KL) | 305.9370 | 114.9578 | 134.5157 | 137.6251 | |
| Gigajoules (GJ) | 10,760.0490 | 4,043.1578 | 4,731.0248 | 4,840.3849 | ||
| Gasoline | Kiloliters (KL) | 203.0400 | 131.5623 | 177.9395 | 142.7666 | |
| Gigajoules (GJ) | 6,631.0021 | 4,296.6405 | 5,811.2550 | 4,662.5573 | ||
| Natural Gas | Cubic Meter (m³) | 6,436,590.1400 | 6,540,025.1500 | 4,635,678.4539 | 4,462,767.5195 | |
| Gigajoules (GJ) | 215,600.0233 | 219,064.6824 | 155,276.6855 | 149,484.8608 | ||
| Liquefied Petroleum Gas | Metric Ton (ton) | 47.2500 | 47.4200 | 59.7000 | 58.9063 | |
| Gigajoules (GJ) | 2,344.3800 | 2,352.8100 | 2,962.1000 | 2,922.4100 | ||
| Refrigeration | Megawatt-hours (MWh) | 0 | 0 | 0 | 0 | |
| Gigajoules (GJ) | 0 | 0 | 0 | 0 | ||
| Total Consumption of Non-Renewable Energy | Gigajoules (GJ) | 4,796,460.6073 | 2,468,635.1915 | 2,283,833.1313 | 1,867,337.6611 | |
| Total Consumption of Renewable Energy | Gigajoules (GJ) | 0 | 783,558.0000 | 961,382.7504 | 1,543,549.8780 | |
| Total Energy Consumption | Gigajoules (GJ) | 4,796,460.6073 | 3,252,193.1915 | 3,245,215.8817 | 3,410,887.5391 | |
| Renewable Energy Usage Rate (All Energy Usage) | (%) | 0.00% | 24.09% | 29.62% | 45.25% | |
- Note 1: The energy data covers the following operational plants: QCI, QSMC, QCMC, QMB, QMH (2024), QMMC (2023-2024), QMF(2023-2024), QMN (2023-2024), and QCG (2023-2024).
- Note 2: Unit conversion for energy consumption: electricity consumption is calculated as usage (MWh) × 3.6 = GJ. The calorific values for diesel, gasoline, and natural gas are based on the "Greenhouse Gas Emission Factor Management Table Version 6.0.4", defined as 8,400 kcal/ L, 7,800 kcal/L, and 8,000 kcal/m3, respectively.
- Note 3: Diesel consumption data specifically covers the following plants: QCI, QSMC, QCMC, QMB, QMH (2024), QMMC (2023- 2024), and QMN (2023-2024).
- Note 4: Renewable Energy Usage Rate (Electricity) = (Self-generated and selfused renewable energy + Purchased renewable energy)/Total electricity consumption; Renewable Energy Usage Rate (All Energy Usage) = Total renewable energy consumption/Total energy consumption.
Renewable Energy Usage
To achieve the Group's goal of using 50% renewable energy by 2030 and ultimately reaching 100%, the Company actively promotes diversified energy solutions across its global operational sites, strengthening energy use resilience through localized strategies. Among them, QSMC adopts a direct green electricity purchase method, complemented by the purchase of green certificates and environmental attribute certificates to increase the proportion of renewable energy usage; QCMC and QMF support green electricity usage through the purchase of green certificates; QCG has fully transitioned to 100% renewable energy through green power supply; QMB continues to expand its solar power installations, with a projected power generation of 4,685.4070 MWh in 2024. Currently, solar power accounts for approximately 5.83% of the total electricity consumption at this plant, with plans to increase this to 10.00% by 2025.
Through the aforementioned diverse initiatives, Quanta has continued to strengthen its renewable energy deployment. In the reporting year, a total of 428,763.8550 MWh of renewable energy was used across nine factory sites, resulting in a renewable energy usage rate of 47.51% — a 16.26% increase compared to 31.25% in 2023. In the future, the Company will continue to monitor global energy market trends and align with global climate action goals, fulfilling its corporate carbon reduction commitments and sustainability responsibilities.
Highlight Story 1
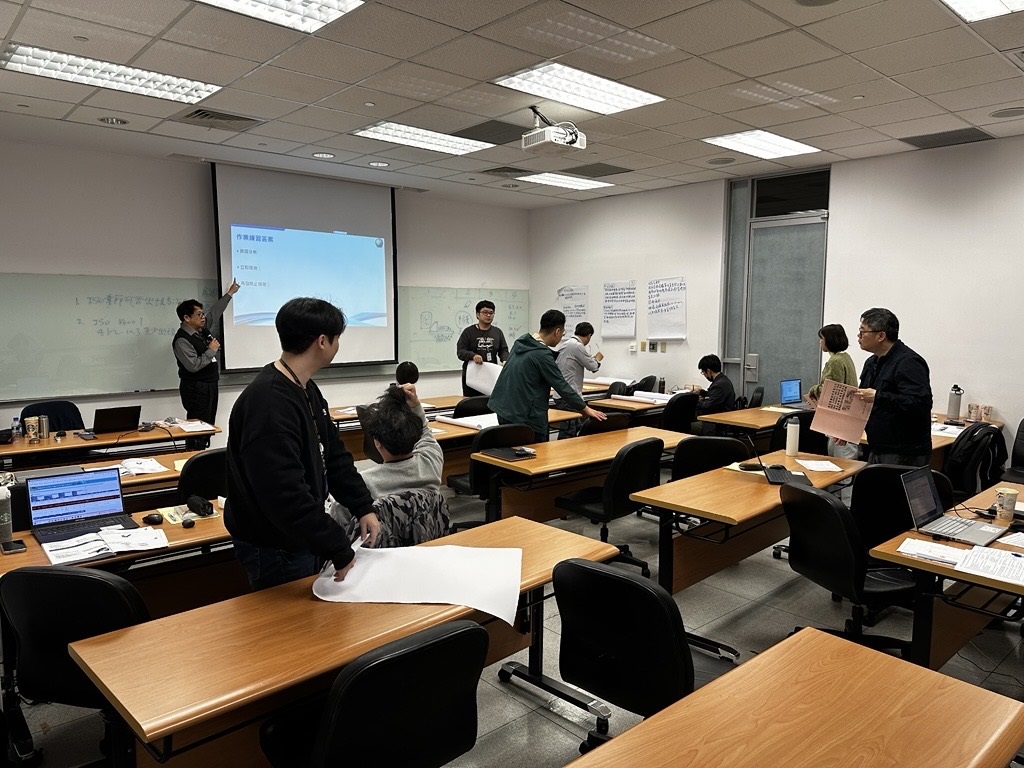
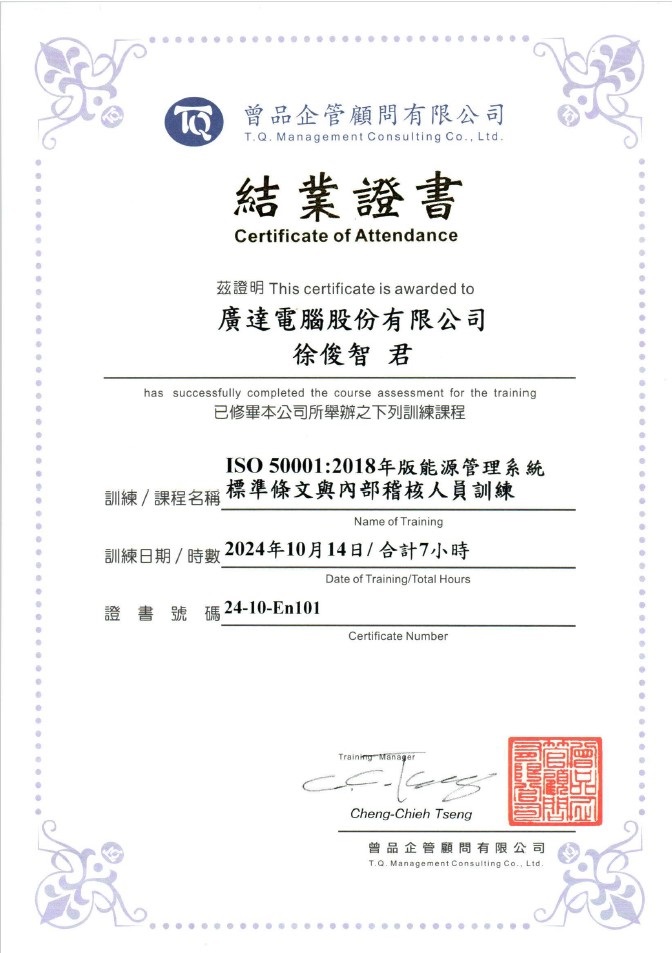
Strengthening Energy Management Capabilities - ISO 50001 Clause and Internal Audit Training
To enhance the practical application and internal audit quality of the Company's energy management system, Quanta regularly conducts training courses on the ISO 50001 energy management standard clauses and internal auditing. The course provides systematic training for personnel involved in energy management. The content covers the latest requirements of the standard clauses, methods for energy performance evaluation, identification of improvement opportunities, and practical exercises on internal audit procedures, ensuring that the team can effectively promote energy management activities.
To expand employee engagement in the energy management system, QCI holds this training course annually. In 2024, a total of 12 participants completed the training. Since 2022, a total of 63 participants from 20 different departments have obtained internal auditor qualifications. This course has not only strengthened the consensus and communication mechanisms for energy management across departments but also enhanced the professional capabilities of internal auditors. It has enabled the Company to more effectively identify high energy consumption risks and propose targeted improvement measures during the implementation and maintenance of the ISO 50001 system. Through institutionalized and ongoing education and training, Quanta continuously deepens the organizational energy management culture, laying a solid foundation for achieving the goals of energy conservation, carbon reduction, and netzero emissions.
Highlight Story 2
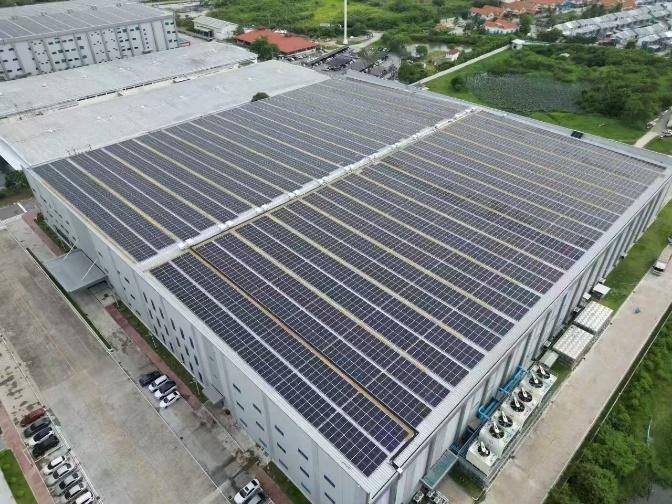
Enhancing Energy Autonomy - Rooftop Solar Power System at the Thailand Plant
To implement energy transition and enhance the autonomy of electricity usage within the plant, QMB has actively invested in the installation of solar power generation facilities. A rooftop photovoltaic system was installed, establishing the site as one of the Group's key hubs for energy transformation.
In 2024, the rooftop solar power system at the QMB plant produced 4,685.4070 MWh of green electricity, equivalent to saving 16,867.4650 GJ of energy consumption, effectively reducing operational carbon emissions. Currently, solar power generation accounts for 5.83% of the total electricity consumption of the plant area. To further enhance the share of renewable energy, it plans to expand its solar infrastructure in the short to medium term, aiming to increase this proportion to 10.00% by 2025.
Through the proactive adoption of renewable energy, the QMB plant not only effectively alleviates electricity demand pressure but also further implements a diversified energy management strategy, embodying Quanta's commitment to actively promoting lowcarbon production and advancing sustainable manufacturing in its global operations.
3.2.2 Greenhouse Gas Emissions
Quanta is deeply aware of the impact that climate change has on the environment and human society. The Company actively fulfills its corporate social responsibility by dedicating efforts to strengthening greenhouse gas management and promoting reduction initiatives. In 2024, Quanta completed GHG inventories across all global operational sites. Among them, QCI, QSMC, QCMC, and QMB , additional sites have obtained third-party verification. Furthermore, to deepen the organization's internal understanding and execution capability regarding carbon emissions issues, the Company also emEphasizes the implementation of capacity building. From 2024 through the first half of 2025, the Group Headquarters' Sustainable Development Center is leading a series of educational training and gap analyses for sites that had not yet undertaken GHG inventories. A total of 17 project sessions were held to assist these locations in rapidly enhancing their management capabilities and operational foundations. Quanta plans to complete greenhouse gas inventories for all major operational sites across the entire Group, including subsidiaries, by 2026, and to obtain third-party verification. These efforts are designed to strengthen the foundation of carbon management and respond to international sustainability disclosure and carbon reduction trends.
Additionally, in response to the carbon emission control policies of local governments at various operational sites, Quanta actively monitors and complies with the carbon emission regulations applicable to each operational location and cooperates with local governments in reporting emission volumes. In Taiwan, the carbon fee system has been officially announced and implemented. Carbon fees are imposed on emission sources at any single operational site with annual emissions exceeding 25,000 metric tons of CO₂e. Quanta has also initiated internal audits and potential cost estimations to support inclusion in cost assessments and carbon reduction strategy planning, continuously enhancing the low-carbon transition capabilities of each operational site.
In 2024, Quanta conducted its greenhouse gas (GHG) inventory in accordance with the ISO 14064-1:2018 standard, covering both qualitative and quantitative assessments of Category 1 (direct GHG emissions) and Category 2 (energy indirect GHG emissions). The inventory included seven types of gases: carbon dioxide (CO₂), methane (CH₄), nitrous oxide (N₂O), hydrofluorocarbons (HFCs), perfluorocarbons (PFCs), sulfur hexafluoride (SF₆), and nitrogen trifluoride (NF₃). The primary sources of emissions include natural gas, diesel, gasoline, liquefied petroleum gas (LPG), CO₂ fire extinguishers, methane emissions from septic systems, refrigerant leakage, and purchased electricity. According to the analysis of historical statistical data, purchased electricity remains the primary source of the company's carbon emissions. In 2024, greenhouse gas emissions generated from purchased electricity based on market benchmarks account for more than 89.44% of the total emissions in Scope 1 and Scope 2 categories.
The year 2024 marks Quanta's first group-wide greenhouse gas inventory, with the scope expanded to cover all subsidiaries within the Quanta Group. The inventory was aligned with the Group's financial reporting boundaries to ensure greater completeness and consistency in disclosure. At the same time, the 2023 inventory data was also adjusted to align with the same boundary criteria, facilitating subsequent trend tracking and annual comparisons. In 2024, Quanta's total carbon emissions (market-based) amounted to 276,122.3273 metric tons of CO₂ equivalent. The carbon emission intensity was approximately 0.1957 metric tons per million NTD in revenue. Compared to 2023, the total carbon emissions decreased by approximately 13.34%.
For Scope 3 greenhouse gas emissions (other indirect emissions), as 2024 marks the Group's first completion of a comprehensive Scope 1 and Scope 2 inventory, internal efforts are currently underway to develop methodologies and consolidate data for Scope 3 assessment. The Group expects to finalize a standardized Scope 3 inventory framework and calculation methodology by 2025, with formal disclosure planned in the 2026 Sustainability Report. This will serve as a significant step toward expanding the carbon management boundary, addressing supply chain risks, and responding to international disclosure trends.
Carbon Emission Intensity per Unit Revenue (Unit: Metric Tons of CO2 Equivalent)
| Performance Indicators | 2023 | 2024 | |
|---|---|---|---|
| Emission Intensity per Unit Revenue | Regional Benchmark | 0.4120 | 0.3197 |
| Market Benchmark | 0.2935 | 0.1957 | |
Greenhouse Gas Emissions (Unit: Metric Tons of CO2 Equivalent)
| Category | 2023 | 2024 | |
|---|---|---|---|
| Category 1 | Stationary Emissions | 11,880.7196 | 10,375.3087 |
| Mobile Emissions | 1,151.7049 | 1,181.6457 | |
| Process Emissions | 0 | 0 | |
| Fugitive Emissions | 15,859.6123 | 17,604.9355 | |
| Subtotal | 28,892.0367 | 29,161.8899 | |
| Category 2 | Regional Benchmark | 418,401.6107 | 421,861.4475 |
| Market Benchmark | 289,739.7589 | 246,960.4374 | |
| Total Emissions from Category 1 & 2 | Regional Benchmark | 447,293.6474 | 451,023.3374 |
| Market Benchmark | 318,631.7956 | 276,122.3273 | |
- Note 1: Greenhouse gas emissions calculation adopts the operational control method.
- Note 2: The scope of the data coverage is aligned with the boundaries of the financial report.
- Note 3: Emission factors for externally purchased electricity at major plants in 2024. QCI (0.4940 kg CO2e/kWh); QSMC (0.4200 kg CO2e/kWh); QCMC (0.5227 kg CO2e/kWh); QMB (0.4401 kg CO2e/kWh); QMH (0.6592 kg CO2e/kWh);QMMC (0.4440 kg CO2e/kWh); QMN (0.28896 kg CO2e/kWh); QMF (0.22569 kg CO2e/kWh); and QCG (0 kg CO2e/kWh).
- Note 4: The greenhouse gas emission results for QCI, QSMC QCMC, QMMC, QMB, Kenseisha (Shanghai) Precision Machining Process, and DRAGONTECH METALLIC INDUSTRY for the year 2024 have been verified by a third-party organization in accordance with ISO 14064-1: 2018, meeting the reasonable assurance level required by the verification agreement.
- Note 5: The Global Warming Potential (GWP) values for greenhouse gases are calculated based on the Intergovernmental Panel on Climate Change (IPCC) Sixth Assessment Report (AR6).
Greenhouse Gas Emissions (Unit: Metric Tons of CO2 Equivalent)
| Category | 2023 | 2024 |
|---|---|---|
| CO₂ | 325,726.3136 | 258,432.7140 |
| CH₄ | 3,020.8723 | 2,807.7600 |
| N₂O | 70.7067 | 46.6721 |
| HFCs | 12,800.6053 | 14,829.1112 |
| PFCs | 0 | 0 |
| SF₆ | 6.0739 | 6.0700 |
| NF₃ | 0 | 0 |
Reduction Actions and Outcomes
To fulfill its net-zero vision and align with international climate commitments, Quanta successfully completed the Science Based Targets (SBT) review in 2024. Using 2022 as the base year, the Company commits to reducing Scope 1 and Scope 2 greenhouse gas emissions by 42% and Scope 3 emissions by 25% by 2030. The long-term target is a 90% reduction in total value chain emissions by 2050. In 2024, Quanta achieved the annual carbon reduction milestone set under the Science Based Targets initiative (SBTi), demonstrating its commitment and effectiveness in implementing climate action.
To support the advancement of carbon reduction targets, Quanta continues to deepen internal energy-saving and carbon reduction initiatives, while expanding lowcarbon operational strategies. Operational sites worldwide are actively implementing energy-saving and low-carbon initiatives, including equipment upgrades and replacements, process optimization, operational model adjustments, employee behavior improvements, and the gradual expansion of green electricity procurement, with the aim of enhancing energy use efficiency and reducing carbon footprints. In 2024, Quanta implemented a total of 81 energy-saving and carbon reduction initiatives, marking an increase of 27 projects compared to 2023. Key measures included the replacement and installation of chiller systems, the installation of smart meters, the installation of variable frequency drives on motors, and the addition of energy-saving devices to boilers. The overall effectiveness was significant and concretely measurable.
Simultaneously, Quanta will continue to advance its climate action plan based on science-based targets, strengthening data foundations and management mechanisms, and integrating various carbon reduction strategies. The Company is steadily progressing toward its phased goals for 2030 and 2050, demonstrating a concrete commitment to addressing climate change.

| Reduction Theme | Number of Projects (cases) |
|---|---|
| Equipment Improvement or Upgrade | 62 |
| Process Redesign | 2 |
| Behavior Change | 16 |
| Operational Changes | 1 |
| Total | 81 |
Note 1: The above data covers QCI QSMC, QCMC, QMB, QMH, QMMC, QMN, QMF, and QCG.
Highlight Story 1
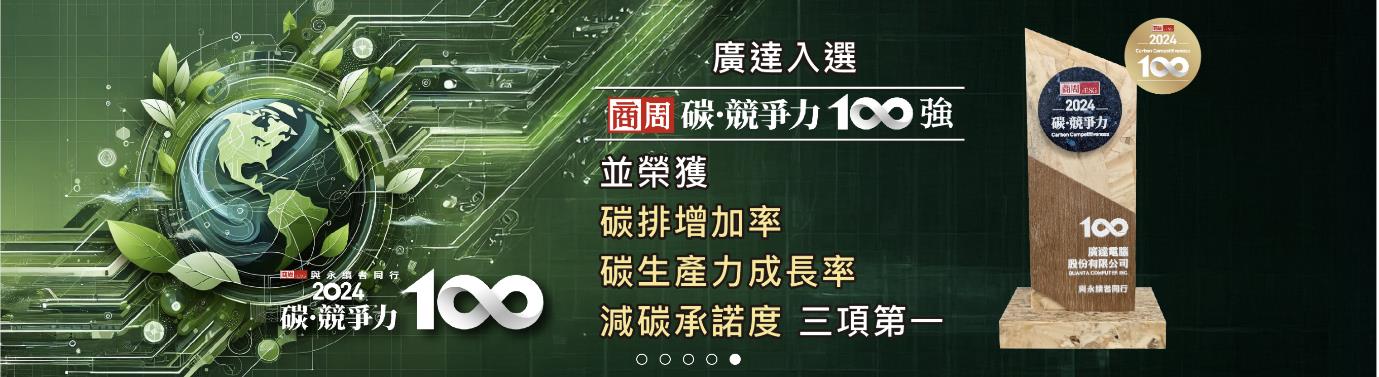
Selected as One of the Top 100 in Carbon Competitiveness, Achieving First Place in Three Key Indicators
In 2024, the Company was successfully selected for the "Top 100 Carbon Competitiveness" list and ranked first in three key indicators: carbon emission growth rate, carbon productivity growth rate, and carbon reduction commitment, reflecting its efforts in carbon management. The evaluation consists of two main components: corporate publicly disclosed data and self-reported questionnaires, offering a comprehensive assessment across multiple dimensions, including commitment to carbon reduction targets, management involvement, and completeness of disclosure.
In recent years, Quanta has actively increased the proportion of green electricity usage. In 2023, green electricity procurement accounted for 27.92% of the total electricity consumption across its four major factory sites. The evaluation results highlighted Quanta's effective integration of carbon reduction initiatives with operational efficiency. This not only strengthens the Company's carbon competitiveness in the electronics manufacturing industry but also supports its continuous progress toward sustainable operation goals.
3.2.3 Water resource management
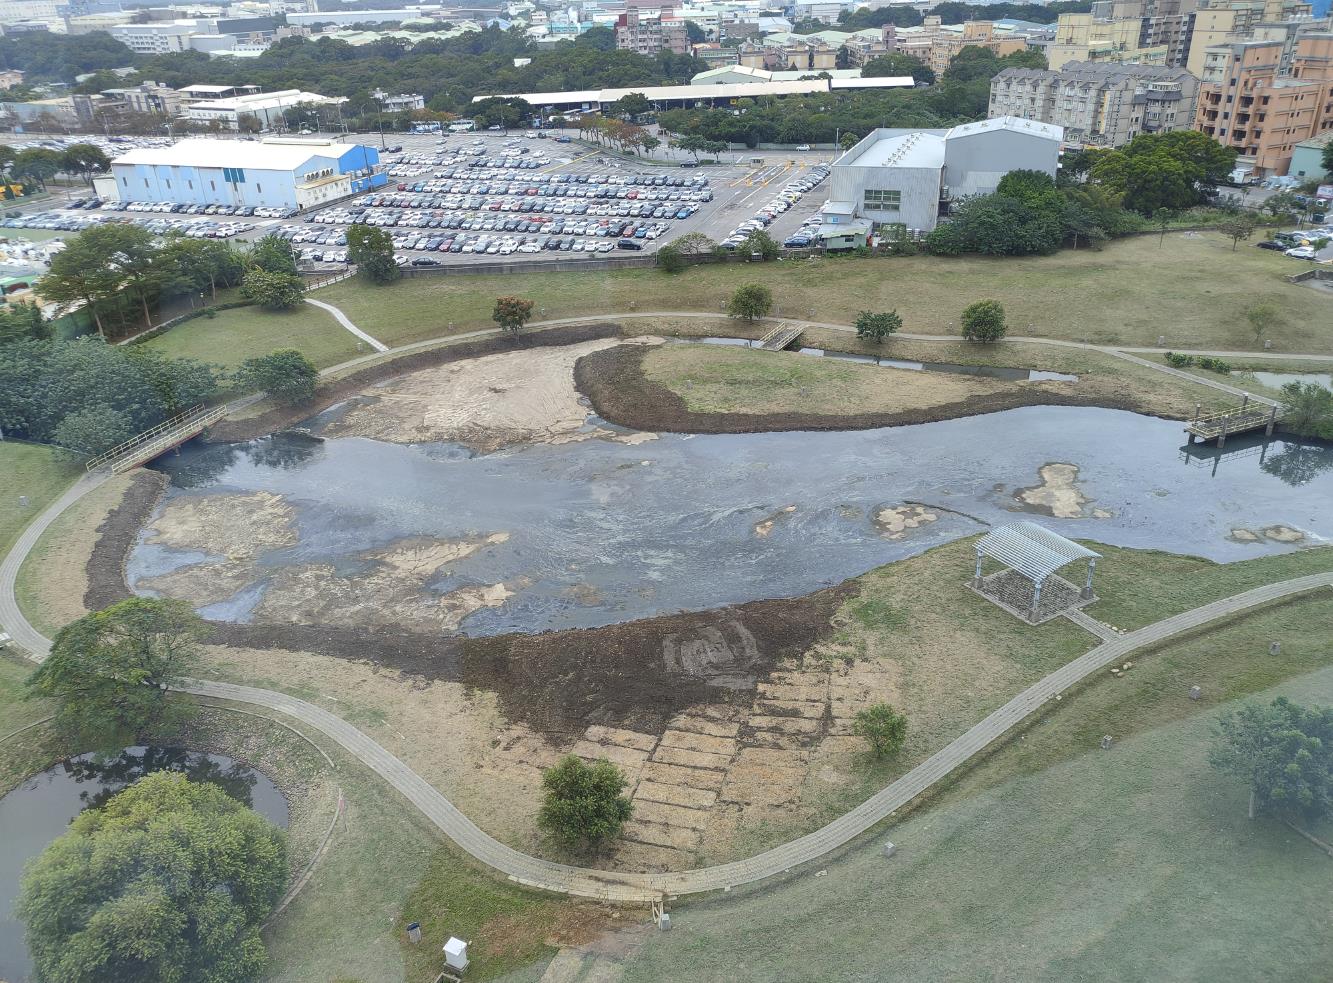
All Quanta manufacturing sites use tap water as their primary water supply source and do not utilize groundwater, seawater, or surface water resources. The overall water usage is primarily for general domestic purposes, air conditioning cooling, and kitchen use, with only a small portion involving process water used for circuit board cleaning. Water sources are stable and neither water withdrawal nor discharge involves areas identified as water-stressed, ensuring minimal impact on local water resources. To enhance water resource management and water conservation effectiveness, Quanta conducts regular annual reviews and continuously optimizes water-saving initiatives and related equipment. In addition to hardware facility improvements, the Company actively participates in local water-related environmental conservation efforts. The Quanta Headquarters R&D Center and Huaya Park Management Consulting Co., Ltd. jointly adopted the flood detention basin upstream of Nankan River from the Taoyuan City Government Water Resources Department, creating an ecologically valuable green park. This demonstrates the Company's substantial commitment to promoting sustainable water resources and ecological integration.
| Water Withdrawal Unit: Cubic Meters | 2021 | 2022 | 2023 | 2024 |
|---|---|---|---|---|
| Surface Water | 0 | 0 | 0 | 0 |
| Groundwater | 0 | 0 | 0 | 0 |
| Seawater | 0 | 0 | 0 | 0 |
| Third-party Water | 5,722,528.2720 | 5,785,797.0610 | 5,198,586.6305 | 4,738,902.4460 |
| Total Water Withdrawal | 5,722,528.2720 | 5,785,797.0610 | 5,198,586.6305 | 4,738,902.4460 |
| Water Discharge Unit: Cubic Meters | 2021 | 2022 | 2023 | 2024 |
|---|---|---|---|---|
| Surface Water | 0 | 0 | 0 | 0 |
| Groundwater | 0 | 0 | 0 | 0 |
| Seawater | 0 | 0 | 0 | 0 |
| Third-party Water | 4,892,433.2112 | 4,893,078.4253 | 4,405,310.3285 | 3,982,288.1480 |
| Total Water Discharge | 4,892,433.2112 | 4,893,078.4253 | 4,405,310.3285 | 3,982,288.1480 |
| Water Consumption Unit: Cubic Meters | 2021 | 2022 | 2023 | 2024 |
|---|---|---|---|---|
| Total Water Consumption | 830,095.0608 | 892,718.6357 | 793,276.3020 | 756,614.2980 |
Note 1: The wastewater discharge volume at QCI is calculated based on direct readings from the sewage flow meter.
Note 2: The wastewater discharge volume at QSMC is estimated as 90% of the tap water intake volume. (Regulatory
Agreement)
Note 3: The wastewater discharge volume at QCMC is calculated as 85% of the tap water intake volume. (Selfestimated
coefficient for domestic wastewater)
Note 4: The wastewater discharge volume at QMB is calculated as 90% of the tap water intake volume. (Self-estimated
coefficient for domestic wastewater)
Note 5: The wastewater discharge volume at QMH is calculated as 80% of the tap water intake volume. (Industrial Park
Water Supply and Discharge Agreement)
Note 6: The wastewater discharge volume for QMMC is calculated as 90% of the tap water intake volume. (Selfestimated
coefficient for domestic wastewater)
Note 7: For the other plants ( QMN, QMF, QCG), due to the lack of previously recorded relevant data, the disclosure in
this report is based on an estimated average wastewater discharge ratio across sites, calculated as 87% of tap
water intake.
Note 8: The above data covers the QCI, QSMC, QCMC, QMB, QMH (2024), QMMC (2022-2024), QMN (2024), QMF (2023-
2024), and QCG.
Water Resource Stress Assessment
Regarding water resource risk assessment, Quanta has implemented the Water Risk Filter tool developed by the Worldwide Fund for Nature (WWF) to regularly evaluate the water resource risks in the regions where its plants are located. If assessment results indicate that a plant is located in a "High risk" or "Very high risk" area, Quanta will implement additional risk management measures and resource allocation strategies to ensure that operations do not place undue pressure on local water resources. It has been confirmed that all nine Quanta plants are located in areas categorized as neither high risk nor very high risk for water stress.
| Plant | Water Stress Level | Water Source for Intake | Wastewater Treatment Unit | Receiving Water Body for Drainage |
|---|---|---|---|---|
| QCI | Moderate | Taiwan Water Corporation | Hwa Ya Technology Park Management Center Wastewater Treatment Plant | Nankan River |
| QSMC | Moderate | Shanghai Songjiang Water Development Co., Ltd | Shanghai Songdong Water Environment Purification Co., Ltd. | Bei Mao Jing River |
| QCMC | Moderate | Chongqing Water Group Co., Ltd., West City Water Supply Branch | Xiyong Wastewater Treatment Plant | Liangtan River |
| QMB | Moderate | Provincial Waterworks Authority | Natural Sedimentation and Sunlight Exposure Pond | Chao Phraya river |
| QMH | Moderate | 1.Công ty nước sạch Mỹ Lộc 2.Nhà máy nước Liên Bảo |
Mei Shun Industrial Park Wastewater Treatment Plant | Sông Tiên Hương-sông Sắt-sông Đáy |
| QMMC | Moderate | Servicios de agua y drenaje de Monterrey | Servicios de agua y drenaje de Monterrey | Santa Catarina River Río Santa Catarina |
| QMF | Moderate | Alameda County Water District | Fremont, California USA | San Francisco Bay and the South Bay aqueduct |
| QMN | Low | City of Lavergne; Metro Water Services |
1. City of Lavergne Utilities Department; 2. Central Wastewater Reclamation; 3. Whites Creek Wastewater Treatment Plant |
J. Percy Priest Lake; CumberlandRiver |
| QCG | Moderate | Reservoir Wehebachtalsperre | Eifel-Rur-Klaeranlage | Water runs into the wastewater treatment |
Note 1: High Risk and Very High Risk in the score of WWF (Water Risk Filter) were defined as areas with water resources pressure.
Wastewater Management
Quanta places great importance on the treatment of wastewater (including sewage) and its potential environmental impact. Domestic sewage contains organic pollutants as well as nutrients such as nitrogen and phosphorus. If not properly treated, it can easily lead to eutrophication of water bodies, thereby adversely affecting the aquatic ecological environment. To mitigate this risk, certain manufacturing sites with specific needs have installed primary wastewater treatment facilities, incorporating processes such as filtration, sedimentation, and flotation. Additionally, dedicated personnel conduct regular inspections and maintenance to effectively remove pollutants, ensuring that the water quality meets standards before discharge.
In addition, Quanta has also commissioned qualified third-party testing agencies to conduct regular water quality sampling and analysis at the manufacturing sites requiring monitoring, in accordance with local regulatory standards. In 2024, the wastewater treatment results at all factory sites complied with the local regulations. All sampling operations strictly follow the technical specifications issued by local authorities to ensure that the monitoring results are scientific and representative. Through standardized processing procedures and institutionalized monitoring mechanisms, Quanta continuously strengthens its responsibility for wastewater management, implements sustainable water resource utilization, and safeguards environmental quality.
| Plant | In Compliance with Standards | Third-Party Testing Frequency | pH Standard | SS Suspended Solids Standard (mg/L) | COD Standard (mg/L) | BOD Standard (mg/L) |
|---|---|---|---|---|---|---|
| QCI | Intake limits for wastewater treatment plant from the management center of Hwa Ya Industrial Park | Every six months | 6-9 | 200 | 350 | 200 |
| QSMC | Integrated Wastewater Discharge Standard (DB31/199- 2018) | Quarterly | 6-9 | 400 | 500 | 300 |
| QCMC | Table 4, Class III Standard Limits of GB8978-1996 "Integrated Wastewater Discharge Standard" | Annually | 6-9 | 400 | 500 | 300 |
| QMB | Limit value announced by Notification of Ministry of Industry Industrial Effluent Standards B.E.2560 | Annually | 9 | 50 | 120 | 20 |
| QMH | Mei Shun Industrial Zone Emission Standards | Quarterly | 5.5-9 | 400 | 600 | 400 |
| QMMC | 《NOM-002-SEMARNAT-1996》 | Every six months | 5.5-10 | 125 | 750 | 200 |
| QMF | San Francisco Bay Regional Water Quality Control Board, California State Water Resource Control Board, EPA |
Each year, a small emission unit is inspected once, but it must be inspected at least once within the five-year permit period. (Equivalent to inspecting approximately 20% of small-scale facilities annually) | 6.5-8.5 | Total suspended solids must not be less than 85%. | 250 |
|
| QMN | NPDS/TDEC/EPA | Quarterly | 6.5-8.5 | 10-15 | 40-60 | 10-15 |
Note 1: The German plant site does not have any regulations, requirements, or controls related to wastewater.
Water Conservation Action
To achieve water conservation goals and comprehensively enhance water use efficiency, Quanta continuously implements diverse water-saving measures and equipment optimization across its global operational sites. The related actions include the installation of sensor-based water-saving devices, the recycling and utilization of rainwater and air conditioning condensate, as well as the promotion of water conservation, thereby addressing both energy saving and carbon reduction alongside sustainable water resource management.
In 2024, the implementation of these projects resulted in a total water savings of 67,088.91 cubic meters across all Quanta plants. The specific water-saving measures and their implementation effectiveness at each plant are outlined below.
| Plant | Water Conservation Plan and Actions | Water Saved in 2024 (Unit: Cubic Meters) |
|---|---|---|
| QCI | Installation of water-saving devices on restroom faucets | 13,750.0000 |
| Rainwater harvesting system at the QC3 plant site | 4,425.0000 | |
| QSMC | Retrofit of showerheads for water efficiency | 18,197.0000 |
| Use of nonwoven fabric filters in air handling units to reduce cleaning frequency | 64.0000 | |
| QCMC | Recovery and reuse of concentrated water from drinking water systems | 9,054.0000 |
| Recovery and reuse of pure and recycled water | 12,262.0000 | |
| QMH | Recovery and reuse of pure and recycled water | 6,768.0000 |
| QMMC | Collection of condensate water from air conditioning systems at F2 Plant | 1,148.0000 |
| Recovery of humidification water from fresh air units at F2 Plant | 1,322.0000 | |
| QCG | Employee engagement and awareness campaigns on water conservation | 98.9100 |
| Total Water Saved (Unit: Cubic Meters) | 67,088.9100 | |
Highlight Story 1
Safeguarding Water Sources through Adoption Initiatives, Corporate Practice of Local Sustainability
To reinforce its commitment to water resource conservation and ecological sustainability, Quanta Headquarters R&D Center, in collaboration with Huaya Park Management Consulting Co., Ltd., actively supported the local government's water co-governance initiative. They proactively adopted the upstream detention basin of Nankan River from the Taoyuan City Government Water Resources Department, working together to promote a governance model that is water-friendly and environmentally harmonious.
The detention basin was originally designed as a hydraulic facility to regulate stormwater runoff and mitigate flood risks. Following the launch of the adoption initiative, the project team embraced an ecology-oriented design approach, introducing native vegetation, creating ecological habitats, and constructing pedestrian walkways. As a result, the site was transformed from a single-purpose flood control installation into a multifunctional community water space that integrates ecological conservation, recreational use, and environmental education.
The implementation of this initiative not only enhances the water quality and retention capacity of the detention basin but also attracts the return of birds, insects, and other wildlife through habitat improvement, thereby strengthening ecosystem diversity. At the same time, it allows local residents to have close contact with natural water bodies, fostering a community consensus and sense of participation in water resource conservation, thereby realizing the sustainable concept of harmonious coexistence and mutual benefit between enterprises and local society.
3.2.4 Waste Management
To reduce the environmental impact of its operations, the Company has implemented comprehensive waste life cycle management and establishes rigorous processes for identification, classification, temporary storage, transfer, and final disposal. The sources of waste encompass electronic components and consumables from the raw material stage, along with offcuts and discarded packaging materials generated during the manufacturing process. To mitigate potential environmental and health risks associated with heavy metals, microplastics, and volatile organic compounds, the Company collaborates with certified waste treatment providers to ensure that all types of waste are properly managed in accordance with regulations. This approach aims to eliminate illegal disposal and incineration activities, thereby preventing secondary pollution of water bodies, soil, and air. At the same time, the Company actively implements source reduction and resource circularity strategies-such as optimizing packaging design, increasing recycling rates, and promoting the regeneration of electronic wasteto minimize resource consumption and carbon emissions. These efforts support the sustainable goals of waste minimization, non-hazardous treatment, and resource recovery. In 2024, 88.57% of Quanta's waste was recycled or reused, while 11.43% was treated through incineration.
| Composition of Waste | Output of Waste (Metric Tons) | Waste Diverted from Disposal (Metric Tons) | Final Disposal of Waste (Metric Tons) | |||||||||
|---|---|---|---|---|---|---|---|---|---|---|---|---|
| 2021 | 2022 | 2023 | 2024 | 2021 | 2022 | 2023 | 2024 | 2021 | 2022 | 2023 | 2024 | |
| Domestic waste | 6,616.8632 | 6,709.4526 | 5,818.8786 | 8,631.6092 | 2,626.3326 | 2,071.7135 | 1,659.7926 | 1,408.1258 | 3,990.5306 | 4,637.7400 | 4,159.0840 | 7,223.4870 |
| Waste paperboard | 30,632.7980 | 30,090.9500 | 21,702.8650 | 24,484.4620 | 30,632.7980 | 30,090.9500 | 21,702.8650 | 24,484.4610 | 0 | 0 | 0 | 0 |
| Waste plastic | 19,133.8687 | 27,074.3635 | 16,220.7490 | 17,943.2158 | 19,133.8687 | 27,074.3665 | 16,220.7490 | 17,943.2118 | 0 | 0 | 0 | 0 |
| Waste wood | 16,669.2150 | 14,971.3330 | 13,399.3100 | 12,989.7270 | 16,669.2150 | 14,971.3330 | 13,399.3100 | 12,989.7300 | 0 | 0 | 0 | 0 |
| Other general waste | 22,074.7142 | 20,382.6400 | 15,507.6865 | 14,491.9309 | 20,155.5842 | 18,722.2617 | 14,715.5065 | 12,894.2639 | 1,919.1300 | 1,660.3800 | 792.1800 | 1,597.6700 |
| PCB edge trim material | 1,781.3268 | 2,301.3748 | 1,438.6000 | 1,420.6815 | 1,781.3268 | 2,301.3748 | 1,438.6000 | 1,420.6785 | 0 | 0 | 0 | 0 |
| Scrap electronic components, offcuts, and defective products | 420.3310 | 112.3447 | 524.4170 | 572.3003 | 420.3310 | 112.3447 | 524.4170 | 572.3003 | 0 | 0 | 0 | 0 |
| Discard UV plastic tubes | 1.7400 | 28.6400 | 27.7750 | 7.4450 | 0 | 0 | 0 | 0 | 1.7400 | 27.7300 | 27.7750 | 7.4450 |
| Waste paint residue | 207.5350 | 209.6800 | 223.6497 | 239.4150 | 0 | 0 | 0 | 0 | 207.5350 | 209.6800 | 223.6497 | 239.4150 |
| Waste paint cans | 71.0150 | 61.6950 | 69.8600 | 69.4850 | 71.0150 | 61.6950 | 69.8600 | 69.4850 | 0 | 0 | 0 | 0 |
| Waste organic solvents | 47.8720 | 43.3340 | 36.6130 | 31.4399 | 0 | 0 | 0 | 0 | 47.8720 | 43.3340 | 36.6130 | 31.4449 |
| Waste activated carbon | 19.6020 | 78.5400 | 150.4260 | 149.2445 | 0 | 66.4000 | 63.3800 | 146.8400 | 19.6020 | 12.1400 | 87.0460 | 2.4010 |
| Waste oil | 11.2200 | 22.3964 | 12.8280 | 16.2480 | 0 | 0 | 0 | 0 | 11.2200 | 22.3964 | 12.8280 | 16.2480 |
| Waste lead-acid batteries | 40.2386 | 44.3520 | 29.8200 | 33.4676 | 40.2386 | 44.3520 | 29.8200 | 31.9716 | 0 | 0 | 0 | 1.5000 |
| Waste rags | 52.1910 | 110.5778 | 82.6320 | 85.4893 | 0 | 0 | 0 | 0 | 52.1910 | 110.5778 | 82.6320 | 85.4913 |
| Waste filters | 3.3700 | 16.3848 | 8.7260 | 9.2400 | 0 | 0 | 0 | 0 | 3.3700 | 16.3848 | 8.7260 | 9.2400 |
| Waste metal scraps | 0 | 6.6050 | 0 | 0 | 0 | 0 | 0 | 0 | 0 | 6.6050 | 0 | 0 |
| Waste hangers | 120.9100 | 130.4900 | 84.6850 | 97.5600 | 0 | 0 | 0 | 0 | 120.9100 | 130.4900 | 84.6850 | 97.5600 |
| Waste acids | 7.5200 | 1.8600 | 4.7600 | 1.5200 | 0 | 0 | 0 | 0 | 7.5200 | 1.8600 | 4.7600 | 1.5200 |
| Waste solvent containers | 26.4000 | 36.1190 | 20.3850 | 17.9620 | 7.7900 | 10.3800 | 5.1500 | 5.0500 | 18.6100 | 25.7400 | 15.2350 | 12.9120 |
| Chemical iron drums | 14.3500 | 14.6200 | 22.6760 | 24.6480 | 0 | 0 | 0 | 0 | 14.3500 | 14.6200 | 22.6800 | 24.6500 |
| Waste emulsifiers | 2.6400 | 2.2800 | 2.4000 | 2.0000 | 0 | 0 | 0 | 0 | 2.6400 | 2.2800 | 2.4000 | 2.0000 |
| Waste liquids with flash point below 60°C | 23.2600 | 52.6800 | 19.6600 | 15.5000 | 0 | 0 | 0 | 0 | 23.2600 | 52.6800 | 19.6600 | 15.5000 |
| Water wash balls | 0.3100 | 0 | 0 | 0.0340 | 0 | 0 | 0 | 0 | 0.3100 | 0 | 0 | 0.0340 |
| Waste paint | 0.8700 | 0 | 0 | 0 | 0 | 0 | 0 | 0 | 0.8700 | 0 | 0 | 0 |
| Spray painting wastewater | 117.8500 | 0 | 0 | 0 | 0 | 0 | 0 | 0 | 117.8500 | 0 | 0 | 0 |
| Waste fluorescent tubes | 1.1000 | 0.0250 | 0.1000 | 0.5240 | 0 | 0 | 0 | 0 | 1.1000 | 0.0300 | 0.1000 | 0.5200 |
| Waste glue | 13.2800 | 16.7600 | 13.1700 | 17.9200 | 0 | 0 | 0 | 0 | 13.2800 | 16.7600 | 13.1650 | 17.9200 |
| Spray cans | 0 | 0.0100 | 0.1000 | 0.3000 | 0 | 0 | 0 | 0 | 0 | 0.0100 | 0.1000 | 0.3000 |
| Aluminum air duct | 0 | 0 | 0 | 0 | 0 | 0 | 0 | 0 | 0 | 0 | 0 | 0 |
| Multi-material packaging | 0 | 0.4800 | 0.9000 | 37.7928 | 0 | 0 | 0 | 0 | 0 | 0.4800 | 0.9000 | 37.7928 |
| Contaminated materials | 0 | 0 | 6.2350 | 14.8096 | 0 | 0 | 0 | 0 | 0 | 0 | 6.2400 | 14.8138 |
| Office electronic equipment | 180.3900 | 1.6000 | 0.8100 | 1,186.2516 | 180.3900 | 1.6000 | 0.8100 | 1,186.2516 | 0 | 0 | 0 | 0 |
| Total amount of waste | 98,292.7805 | 102,521.5876 | 75,430.7168 | 82,592.2230 | 91,718.8899 | 95,528.7712 | 69,830.2601 | 73,152.3695 | 6,573.8906 | 6,991.9180 | 5,600.4587 | 9,439.8648 |
Note 1: The above data covers the QCI, QSMC, QCMC, QMB, QMH (2024), QMMC (2022-2024), and QMN(2024).
Waste removed from disposal through recycling operations (Unit: metric tons)
| Hazardous waste | Total | |||
|---|---|---|---|---|
| 2021 | 2022 | 2023 | 2024 | |
| Reuse | 7.7900 | 8.0800 | 5.1500 | 5.0500 |
| Recycle | 1,328.6845 | 1,748.0200 | 1,189.1500 | 1,088.4440 |
| Other recovery operations | 0 | 0 | 0 | 0 |
| Total | 1,336.4745 | 1,756.1000 | 1,194.3000 | 1,093.4940 |
| Non-hazardous waste | Total | |||
|---|---|---|---|---|
| 2021 | 2022 | 2023 | 2024 | |
| Reuse | 0 | 68.7000 | 63.3800 | 95.4500 |
| Recycle | 90,382.4204 | 93,294.2751 | 68,348.4285 | 71,722.8453 |
| Other recovery operations | 0 | 409.6900 | 224.1500 | 240.5800 |
| Total | 90,382.4204 | 93,772.6651 | 68,635.9585 | 72,058.8753 |
Note 1: The above data covers the QCI, QSMC, QCMC, QMB, QMH (2024), QMMC (2022-2024), and QMN(2024).
Waste disposed of through final disposal operations (Unit: metric tons)
| Hazardous waste | Total | |||
|---|---|---|---|---|
| 2021 | 2022 | 2023 | 2024 | |
| Incineration (with energy recovery) | 664.2300 | 686.7000 | 627.7000 | 576.6200 |
| Incineration (without energy recovery) | 0 | 8.0000 | 18.6300 | 31.9500 |
| Landfill | 0 | 0 | 0 | 0 |
| Other disposal operations | 0 | 0 | 1.7200 | 3.8600 |
| Total | 664.2300 | 694.7000 | 648.0500 | 612.4300 |
| Non-hazardous waste | Total | |||
|---|---|---|---|---|
| 2021 | 2022 | 2023 | 2024 | |
| Incineration (with energy recovery) | 5,877.2960 | 5,457.6500 | 3,994.3500 | 7,705.6700 |
| Incineration (without energy recovery) | 0 | 0 | 0 | 0 |
| Landfill | 32.3650 | 839.5700 | 958.0600 | 1,121.7600 |
| Other disposal operations | 0 | 0 | 0 | 0 |
| Total | 5,909.6610 | 6,297.2200 | 4,952.4100 | 8,827.4270 |
- Note 1: The above data covers the QCI, QSMC, QCMC, QMB, QMH (2024), QMMC(2022-2024), and QMN (2024).
- Note 2: Other disposal operations primarily refer to sealed disposal conducted at the QMMC.
Waste Reduction
The Company upholds the principles of effective management and continuous reduction, systematically promoting waste management and reduction initiatives. Each operational site implements waste classification, collection, and recycling in accordance with local regulations. Through three major action directions-source waste prevention, third-party supervision, and data monitoring-Quanta applies and continuously refines a multi-faceted strategy aimed at reducing waste generation intensity, improving resource recycling efficiency, and increasing waste-to-resource conversion rates year over year.
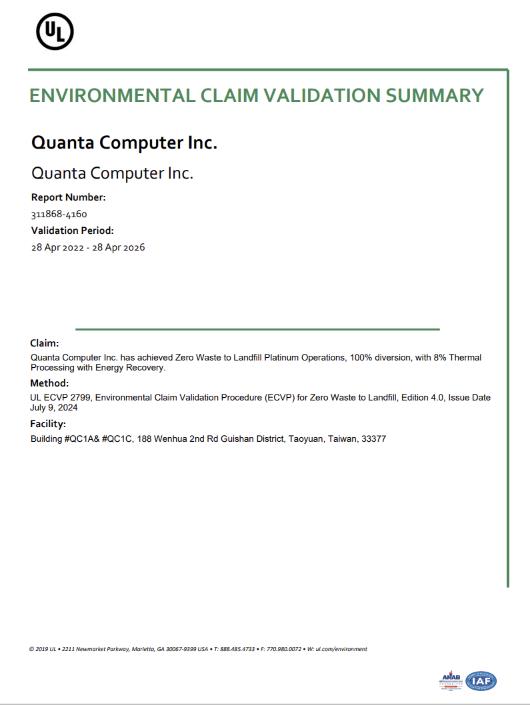
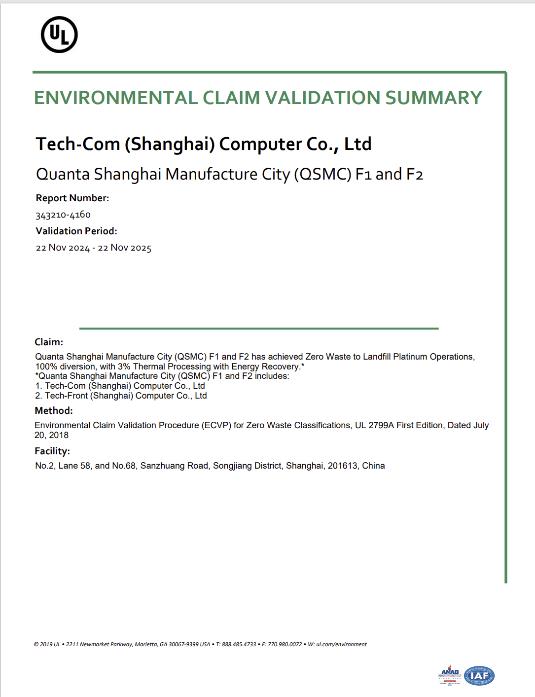
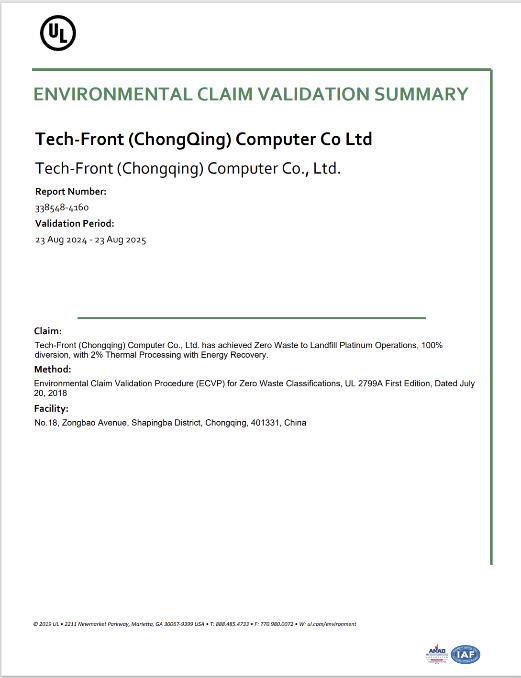
In terms of source waste prevention, the Company focuses on equipment selection, process optimization, and supply chain management, implementing lean production and extending the lifespan of consumables. In 2024, the QCI saved 19.8400 metric tons of waste by improving the carrier cleaning operation process and reusing discarded wiping paper. On the other hand, Quanta requires suppliers to provide material certifications that comply with RoHS and REACH regulations, in order to restrict the use of highrisk chemical substances. Regarding third-party supervision, the Company selects qualified vendors holding waste disposal permits and establishes clear contractual terms requiring that no illegal cross-border disposal occurs. Additionally, the vendors must provide traceable waste treatment reports. Additionally, by conducting compliance audits annually, the quality and legality of contracted services are ensured. In terms of data monitoring, the Company has established a waste classification monitoring system covering packaging waste, domestic waste, and defective products from the manufacturing process. Through the use of weighbridge measurements and an automatic data uploading system, semi-annual summaries and annual cross-sectional comparative analyses are conducted to support ongoing improvement efforts. Through these initiatives, the Company has obtained UL2799 "Zero Waste to Landfill" certification for multiple manufacturing sites, with some achieving the highest platinum level standard, demonstrating the Company's efforts and achievements in resource circularity and waste reduction.
| Unit | 2021 | 2022 | 2023 | 2024 | |
|---|---|---|---|---|---|
| Waste Generation Intensity | tons/ NT$ million | 0.0870 | 0.0801 | 0.0695 | 0.0585 |
| Waste Conversion Rate | % | 99.97% | 99.17% | 98.70% | 98.60% |
Air Pollution Management
The Company is committed to air pollution prevention and control, strictly managing waste gas emissions at its operational sites in accordance with relevant environmental protection regulations. This includes the control and monitoring of pollutants such as volatile organic compounds (VOCs), nitrogen oxides (NOx), sulfur oxides (SOx), and particulate matter (PM). By installing appropriate treatment equipment and conducting regular maintenance, ensure that the emission concentration complies with regulatory standards. In addition, the Company has completely eliminated substances containing ozone-depleting substances (ODS) in all manufacturing processes, achieving zero ODS emissions each year. In 2024, the Company reported zero major environmental pollution incidents and received no related penalties.
Nitrogen Oxides (NOx), Sulfur Oxides (SOx), and Other Significant Air Emissions
| Gas | 2021 | 2022 | 2023 | 2024 |
|---|---|---|---|---|
| Nitrogen Oxides (NOx) | 131.9100 | 112.2600 | 0 | 102.8000 |
| Sulfur Oxides (SOx) | 2.6900 | 2.9500 | 0 | 8.0300 |
| Persistent Organic Pollutants (POPs) | 0 | 0 | 0 | 0 |
| Volatile Organic Compounds (VOC) | 14.0608 | 69.7611 | 58.7213 | 93.9868 |
| Hazardous Air Pollutants (HAP) | 0 | 0 | 0 | 0 |
| Particulate Matter (PM) | 0.1600 | 0.3200 | 6.7935 | 12.5002 |
| Total Quantity (Unit: Metric Tons) | 148.8208 | 185.2911 | 65.5148 | 217.3170 |
Note 1: The above data covers QCI, QSMC (2024), QCMC, QMB(2021, 2022, 2024), QMH (2024), QMMC (2023, 2024), and QMN (2022-2024).
Highlight Story 1
Milestone Towards Zero Waste Landfill-QCI, QSMC, and QCMC Achieve UL2799 Platinum Certification
To enhance waste management effectiveness, Quanta has actively adopted international certification standards and progressively implemented the "Zero Waste to Landfill Program" across its manufacturing sites. The program is guided by the globally recognized UL ECVP 2799 Zero Waste to Landfill standard, which emphasizes full transparency and traceability of all waste streams. All waste must be properly handled through recycling, reuse, or energy recovery, and is subject to stringent compliance controls, on-site inspections, and third-party audits to verify that landfill disposal is not used at the end of its lifecycle. When the overall waste conversion rate reaches 80% or above, the enterprise can obtain certification. In 2024, the Company successfully led multiple plants to obtain this international certification. The QCI, QSMC, and QCMC achieved platinum-level certification with a 100% waste conversion rate, while the QMB earned silver-level certification. In the future, Quanta will continue to advance toward achieving the goal of zero waste to landfill across all manufacturing sites, establishing a model that aligns with the vision of sustainable development.
Multiple Plants Obtained International Certifications
Highlight Story 2
Implementation of Automated PCB Cleaning Equipment to Achieve Organic Solvent Recycling
To enhance process efficiency and reduce waste generation, QCMC has implemented fully automatic PCB cleaning and drying equipment in 2022. In the traditional process, cleaning excess solder paste from the PCB required multiple steps, including manual alcohol wiping, ultrasonic cleaning, hot water rinsing, and air gun drying. After switching to fully automated equipment, washing and drying can be completed in an integrated process, and organic solvents can be recycled and reused through the system, significantly reducing the generation of waste liquid. Using the year 2022 as the baseline (with 28.86 tons of waste organic solvent disposed), this improvement measure has achieved an actual reduction of 21.3610 tons in 2023, and a further reduction of 19.21 tons in 2024, demonstrating Quanta's ongoing commitment to process optimization and advancing toward green manufacturing.